Graph information
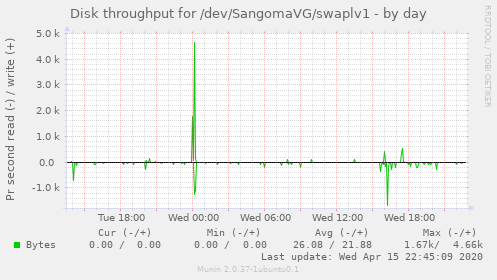
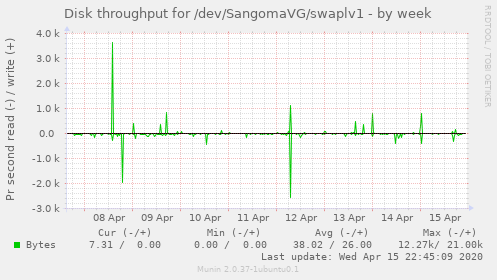
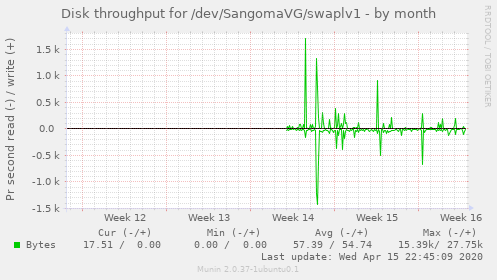
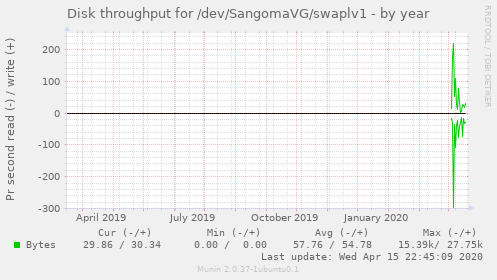
This graph shows disk throughput in bytes pr ${graph_period}. The graph base is 1024 so KB is for Kibi bytes and so on.
| Field | Internal name | Type | Warning | Critical | Info |
|---|---|---|---|---|---|
| Bytes | wrbytes | gauge |
Zooming is very easy, it's done in 3 clicks ( regular clicks, no drag & drop ):
- Click to define the start of zoom.
- Click to define the ending of zoom.
- Click inside shaded area to zoom, outside to cancel.
Shortcut: To just set a new start of zoom, click before your start point for your second click.
You can use the interactive form too.